
The Ultimate Guide to Web Performance: From Core Web Vitals to Advanced JavaScript Optimization
In the digital age, a user’s attention span is measured in seconds. A slow-loading website doesn’t just frustrate visitors; it directly impacts user engagement, conversion rates, and search engine rankings. Web performance is no longer a “nice-to-have” feature—it’s a critical component of a successful online presence. While the topic can seem daunting, understanding the core principles and applying modern JavaScript techniques can transform a sluggish site into a lightning-fast experience.
This comprehensive guide will demystify the world of web performance. We’ll dive deep into Google’s Core Web Vitals, explore practical JavaScript optimization strategies, and uncover advanced APIs like Web Workers and Service Workers. Whether you’re a seasoned developer or just starting your journey with JavaScript, this article provides actionable insights and practical code examples to help you master the art and science of site speed. Get ready to optimize your code, delight your users, and climb the search rankings.
Understanding the Pillars of Web Performance
Before diving into code, it’s essential to understand the “what” and “why” of web performance. Performance isn’t just about a single number; it’s a measure of user experience. Google has distilled this into a set of key metrics known as Core Web Vitals (CWV), which quantify the real-world experience of your users.
Decoding Core Web Vitals (CWV)
Core Web Vitals are a set of specific factors that Google considers important in a webpage’s overall user experience. They are made up of three primary metrics:
- Largest Contentful Paint (LCP): This measures loading performance. It marks the point in the page load timeline when the main content—typically the largest image or text block in the viewport—has likely loaded. A good LCP score is 2.5 seconds or less.
- Interaction to Next Paint (INP): This measures interactivity. INP assesses a page’s overall responsiveness to user interactions by observing the latency of all clicks, taps, and keyboard interactions. It has replaced First Input Delay (FID) as a core metric. A good INP is below 200 milliseconds.
- Cumulative Layout Shift (CLS): This measures visual stability. It quantifies how much unexpected layout shift occurs during the entire lifespan of the page. A low CLS helps ensure that the page is delightful and not frustrating. A good score is 0.1 or less.
The JavaScript Bottleneck: Blocking the Main Thread
JavaScript is the engine of modern web applications, but it’s also frequently the primary cause of poor performance, especially for interactivity (INP). The browser’s main thread is responsible for handling everything from parsing HTML and CSS to executing JavaScript and responding to user input. When you run a long, synchronous JavaScript task, you block this thread. The result? The UI freezes, clicks are ignored, and the user perceives the page as broken.
Consider this simple but illustrative example of a task that blocks the main thread:
// main.js

// Function to simulate a long-running, synchronous task
function blockMainThread() {
  console.log('Blocking task started...');
  const start = Date.now();
  // Loop for 3 seconds to simulate heavy computation
  while (Date.now() - start < 3000) {
    // This loop does nothing but waste CPU time
  }
  console.log('Blocking task finished.');
}

document.getElementById('blocking-btn').addEventListener('click', () => {
  blockMainThread();
});

document.getElementById('non-blocking-btn').addEventListener('click', () => {
  alert('I am responsive!');
});
In this scenario, if a user clicks the “blocking-btn”, the entire UI will freeze for three seconds. During this time, clicking the “non-blocking-btn” will do nothing. This is the core problem we need to solve to improve INP and overall web performance.
Practical JavaScript Optimization Techniques
Now that we understand the problem, let’s explore practical solutions. Modern JavaScript, with its powerful asynchronous capabilities and module system, provides all the tools we need to write high-performance code.

Asynchronous JavaScript: Promises and Async/Await
The key to unblocking the main thread is asynchronous programming. Instead of waiting for a task to complete, we can initiate it and let the browser continue with other work. When the task is finished, it notifies us. Promises JavaScript and the syntactic sugar of Async/Await are the modern standards for handling this.
Let’s refactor our data-fetching logic. Instead of a synchronous process, we can use the JavaScript Fetch API, which is promise-based by default.
// Using Async/Await with the Fetch API for clean, non-blocking code

async function fetchUserData() {
  try {
    console.log('Fetching user data...');
    // The 'await' keyword pauses the function execution without blocking the main thread
    const response = await fetch('https://jsonplaceholder.typicode.com/users/1');

    if (!response.ok) {
      throw new Error(`HTTP error! status: ${response.status}`);
    }

    // This line will only run after the network request is complete
    const userData = await response.json();

    console.log('Data received:', userData);
    // Now you can update the DOM with the user data
    document.getElementById('user-name').textContent = userData.name;

  } catch (error) {
    console.error('Could not fetch user data:', error);
  }
}

// Call the async function
fetchUserData();
console.log('This message logs immediately, before the data is fetched.');
By using async/await, the network request happens in the background. The main thread is free to handle user interactions, animations, and other tasks while waiting for the data to arrive, dramatically improving perceived performance and the INP score.
Efficient DOM Manipulation
Interacting with the JavaScript DOM is expensive. Each time you add, remove, or change an element, the browser may need to perform a “reflow” (recalculating the layout of elements) and a “repaint” (redrawing the pixels on the screen). Doing this repeatedly in a loop is a classic performance pitfall.
To avoid this, batch your DOM updates. Create all the necessary elements in memory first using a DocumentFragment, a lightweight container, and then append the fragment to the DOM in a single operation.
// Inefficient: Appending to the DOM in a loop causes multiple reflows
function createListInefficiently(items) {
  const list = document.getElementById('my-list');
  for (const item of items) {
    const li = document.createElement('li');
    li.textContent = item;
    list.appendChild(li); // Bad: Appending inside the loop
  }
}

// Efficient: Using a DocumentFragment to batch DOM updates
function createListEfficiently(items) {
  const list = document.getElementById('my-list');
  const fragment = document.createDocumentFragment(); // Create a fragment in memory

  for (const item of items) {
    const li = document.createElement('li');
    li.textContent = item;
    fragment.appendChild(li); // Append to the fragment (no reflow)
  }

  // Append the entire fragment to the DOM in one operation
  list.appendChild(fragment);
}

const data = ['Apple', 'Banana', 'Cherry', 'Date', 'Elderberry'];
// Choose the efficient method for better performance
createListEfficiently(data);
Advanced Performance Strategies and Modern APIs
For complex applications, you may need to reach for more advanced tools. Modern browser APIs provide powerful ways to offload work from the main thread and build resilient, offline-first experiences.
Leveraging Web Workers for Heavy Computation
What if you need to perform a truly CPU-intensive task, like complex data processing, image filtering, or parsing a large file? Even if it’s asynchronous, it can still bog down the main thread if it involves heavy computation. This is where Web Workers come in.
A Web Worker is a JavaScript script that runs on a background thread, completely separate from the main thread. This allows you to perform heavy lifting without freezing the UI. Communication between the main thread and the worker is handled through a system of messages.
Here’s a basic example. The main script offloads a heavy calculation to a worker.
// main.js - The script running on the main thread

if (window.Worker) {
  const myWorker = new Worker('worker.js');

  // Send a message to the worker to start the calculation
  console.log('Main: Posting message to worker.');
  myWorker.postMessage({ command: 'calculateSum', limit: 1000000000 });

  // Listen for messages back from the worker
  myWorker.onmessage = function(e) {
    console.log('Main: Message received from worker:', e.data);
    alert(`The final sum is: ${e.data.result}`);
  };

  myWorker.onerror = function(e) {
    console.error('Main: Error in worker:', e);
  };

} else {
  console.log('Your browser doesn\'t support Web Workers.');
}

// --- worker.js --- The script for the background thread

self.onmessage = function(e) {
  console.log('Worker: Message received from main script');
  if (e.data.command === 'calculateSum') {
    let sum = 0;
    for (let i = 0; i < e.data.limit; i++) {
      sum += i;
    }
    // Post the result back to the main thread
    self.postMessage({ result: sum });
  }
};
Using Web Workers is a game-changer for applications that need to process large amounts of data while maintaining a perfectly smooth and responsive user interface.
Caching with Service Workers for Offline-First Apps
Service Workers are another type of web worker that acts as a programmable network proxy between your web application, the browser, and the network. They are the cornerstone of Progressive Web Apps (PWA) and enable powerful features like offline access, push notifications, and sophisticated caching strategies.
By intercepting network requests, a Service Worker can decide whether to serve a response from the cache or fetch it from the network. This allows your application to load instantly on repeat visits, even with a poor or non-existent internet connection, dramatically improving the user experience.
Best Practices and Performance Tooling
Writing performant code is only half the battle. You also need to measure, monitor, and continuously optimize. The right tools and practices are essential for maintaining a fast website.
Measuring What Matters: Tools of the Trade

You can’t improve what you don’t measure. Use a combination of lab and field data tools:
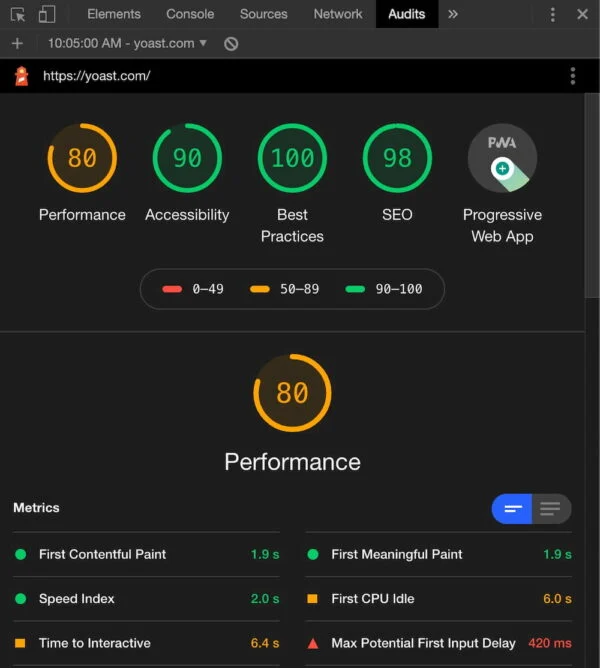
- Lighthouse: An open-source, automated tool integrated into Chrome DevTools for auditing performance, accessibility, PWAs, and SEO. It provides “lab data”—a performance snapshot under specific conditions.
- Chrome DevTools Performance Tab: Allows you to record and analyze every activity on your page, helping you pinpoint specific JavaScript functions or rendering processes that are causing bottlenecks.
- CrUX (Chrome User Experience Report): Provides “field data” from real Chrome users who have opted-in to share it. This data powers tools like PageSpeed Insights and shows how your site performs in the real world.
- Webpack Bundle Analyzer: If you’re using a bundler like
WebpackorVite, this tool generates a visual map of your JavaScript bundles, helping you identify large dependencies that could be code-split or removed.
Asset Optimization and Build Tools
Your JavaScript Performance is tied to the overall asset loading strategy. Always follow these best practices:
- Minify and Compress: Use tools like Terser (for JavaScript) and configure your server to use Gzip or Brotli compression to significantly reduce file sizes.
- Image Optimization: Serve images in modern formats like WebP or AVIF, use responsive images with the
<picture>element, and lazy-load offscreen images. - Code Splitting: Use your bundler’s capabilities to split your code into smaller chunks. Load the essential JavaScript first, and then lazy-load other features on demand using dynamic
import(). This is a core feature of modernJavaScript BundlerslikeViteandWebpack. - Use a CDN: A Content Delivery Network (CDN) caches your assets at edge locations around the world, reducing latency for users by serving files from a server that is geographically closer to them.
Conclusion
Web performance is a deep and multifaceted discipline, but its foundation rests on a simple principle: respect the user’s time and device resources. By understanding and optimizing for Core Web Vitals, you align your development goals with user experience goals.
We’ve journeyed from the basics of the main thread to advanced techniques like Web Workers and Service Workers. The key takeaways are to prioritize asynchronous operations using Async/Await, be mindful of DOM performance, and offload heavy tasks whenever possible. Embrace modern JavaScript Tools and bundlers like Vite to automate many of these optimizations through features like code-splitting and minification.
Performance is not a one-time fix; it’s an ongoing commitment. Continuously measure your site’s performance with tools like Lighthouse and CrUX, identify bottlenecks, and iterate. By embedding these practices into your development workflow, you can build faster, more resilient, and more engaging web experiences that stand out in a crowded digital landscape.